Before you get started, it is important to understand what
types of reports are available and the information they contain. You must have
permissions to manage and access reports in the Portal to use reporting.
Below are general descriptions of some of the details you
will find when you run a report.
Results summary
For all reports, a results summary is displayed along with
graphical information (also can be displayed as a list) containing the report’s
data points. The results summary includes the following information:
|
Report details |
Description |
|
Total views |
The total
number of times the presentations specified in the report were watched
(includes live and on-demand views). |
|
Views (x live views, y on-demand views) |
The number of times the presentations specified in
the report were watched live and on-demand. |
|
Watched (x of y) |
The number of
presentations watched out of the total number of presentations included in
the report. |
|
Time |
The total amount of time (h:mm:ss) users spent
watching the selected presentations. |
|
Peak |
The highest number of concurrent views for the
presentation. |
|
Clients (x User, y IP
Address) |
The number of unique users who have viewed the
presentations. The number of unique IP addresses used to view the
presentations. |
|
Clients (x User, y IP Address, z
referrers) |
The number of unique users who have viewed the
presentations. The number of unique IP addresses used to view the
presentations. The number of unique machines or sites from which users
began watching the presentations, for example, when presentations have
been embedded or their links shared. This information is in the server
statistics reports. |
|
Watched (x of y presentations, x
of y presenters) |
The number of presentations watched out of the total
number of presentations included in the report. The number of presenters’
presentations watched out of all presenters included in report. This
information is in the presenter statistics
reports. |
Presentation, presenter, authoring, and user
statistics reports
The data displayed in presentation, presenter, user, and
authoring statistics reports depend on the top-level view selected. The
top-level views include statistic type (presentation, presenter, and user), date
activity, and platform. For example, in a presentation statistics report, the
top-level views are:
Presentation (statistic type):
Click Presentations to view data for each presentation
included in the report. The data can be sorted by attribute (presentation, total
views, etc.) as well as in ascending and descending order. The data can be
displayed as a bar graph or as a list. Drill down support is available for each
item. For example, clicking on a presentation will display its Presentation Summary report.
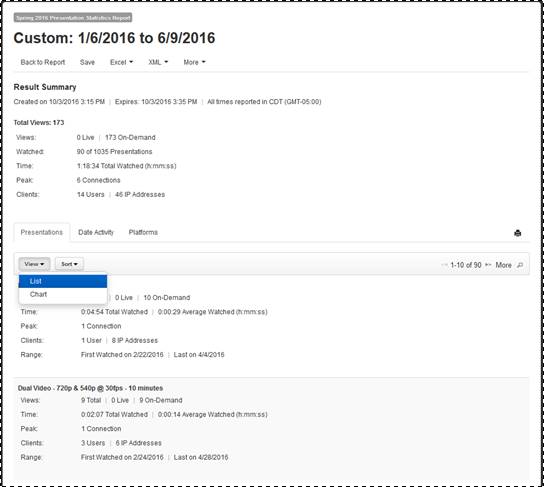
Sample Presentation Statistics Report (Presentations List
View)
Date Activity: Click Date Activity to view graphical data and a grid showing the
viewing growth, total number of views, and peak connections for presentations
specified in the report. You can view the data by day or month. Mouse-over a
point in the graph to see details for a specific data point. For example, when
displaying the date activity graph with the Show Views
and By Day options selected, you will see the number
of views on a particular day.
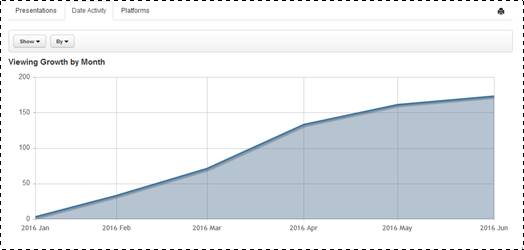
Presentation Statistics Report (Date Activity View, Viewing
Growth)
Platforms: Click Platform to see graphical
data showing the total views for each browser, platform, system, player and
media plugin supported in Mediasite. You can change the information displayed
and the graphical style, using the Show and Style drop-down lists, respectively.
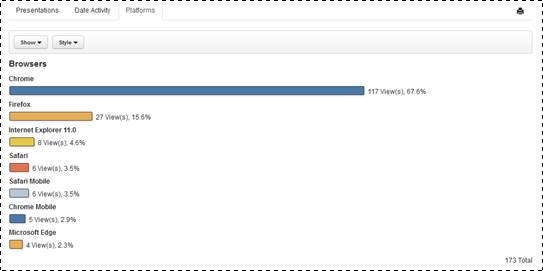
Platforms, bar graph
Summary (presentation, user, and presenter)
reports
When you view a report, you can click on a presentation,
presenter, or user’s link to view its summary report. The data available will
vary by report. Many of the reports contain the same data you will find at the
top-level but for the selected item only.
In some reports, there will be additional information
(views). For example, in a presentation summary report also includes information
about users, IP addresses, and viewing trends in addition to date activity and
platforms. For many of these views, you can drill down even further.
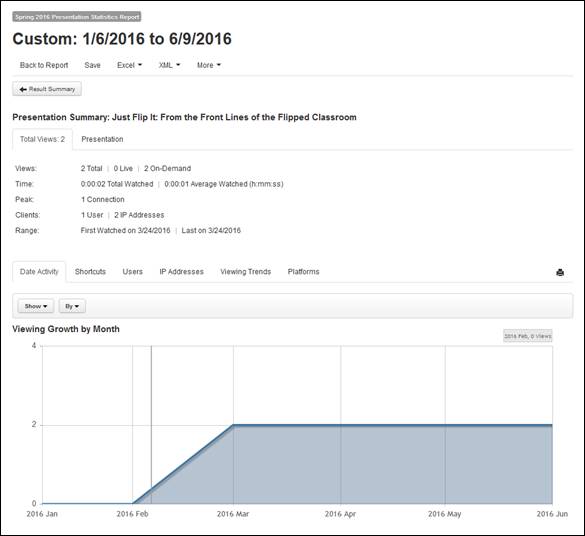
Presentation summary report
Below are descriptions of some of the additional reports
you may find in summary reports as you drill down for additional data in the
presentation summary report.
Shortcuts: Provides viewing
statistics for each shortcut created from the target presentation.
Viewing trends: Many of the
reports use bar graphs and pie charts to display data but the viewing trends
report shows an intensity graph that highlights which parts of presentations
were viewed most. Views less than 60 seconds in duration are not displayed in
the graph and grid. You can view trends for all users or click on a user in the
grid to view their individual session report and gain granular insight into
trends.
You can select the display format for the viewing trends
data: a multi-colored intensity (heat) graph with different colors representing
the amount of views, a monochromatic intensity graph with increasing intensity
(deeper color) representing higher number of views, or a linear graph
representing the total number of views.
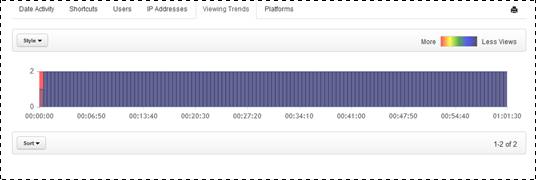
Viewing trends data (Heat)
Users: In this view, you can see
which users viewed the presentation, the number of views they had and what
percentage of the presentation they viewed. You can sort the information
displayed by user, total views, coverage, etc.
Click the link for the user to view the user summary report
with date activity, viewing trends and platform views.
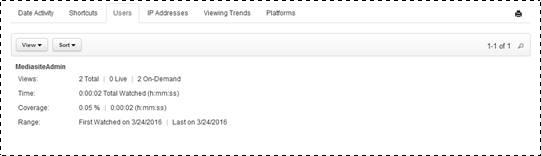
Presentation summary report (Users
view)
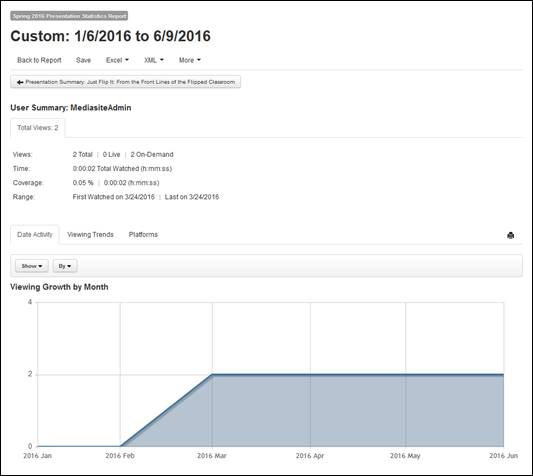
User summary report (Date Activity
view)
 Each time a user opens a
presentation and clicks the Play button, it is counted as one (1) view. Pausing
and restarting a presentation in the same session is not considered a separate
view.
Each time a user opens a
presentation and clicks the Play button, it is counted as one (1) view. Pausing
and restarting a presentation in the same session is not considered a separate
view.
IP Addresses: In this view, you
can see which IP addresses were used to view the presentation, the number of
views they had, and the percentage of the presentation viewed. You can sort the
information displayed by IP address, total views, coverage, etc.
Click the link for a user to view the IP address summary
report with date activity, viewing trends and platform views.

Presentation
summary report (IP Addresses view)
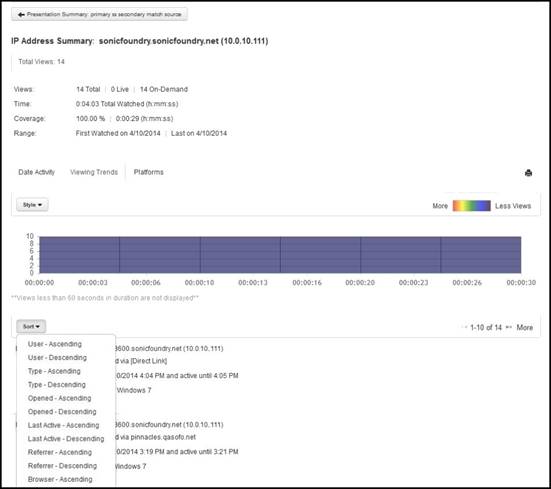
IP
address summary report (viewing trends view)
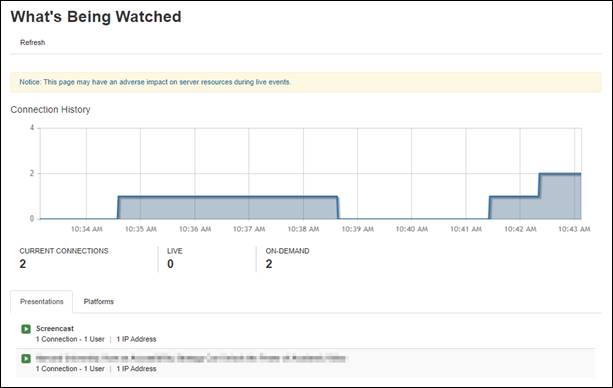
 WARNING: Viewing
the What’s Being Watched
report during live events may have an adverse impact on server
resources.
WARNING: Viewing
the What’s Being Watched
report during live events may have an adverse impact on server
resources. You can view specific details about who
is watching a presentation on the Who’s Watching Now report available on its
properties page. This feature is permission based.
You can view specific details about who
is watching a presentation on the Who’s Watching Now report available on its
properties page. This feature is permission based.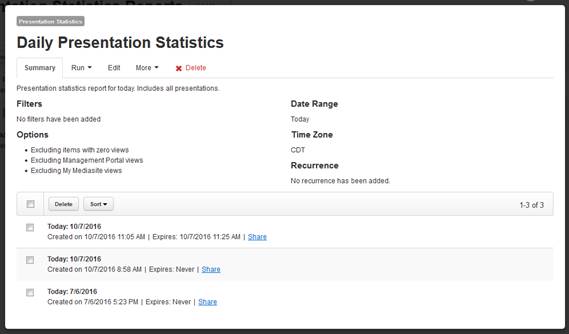
 You can view and edit the settings for
pre-defined reports as well as create new reports based on them.
You can view and edit the settings for
pre-defined reports as well as create new reports based on them.