Create a User Statistics report to see a specific user's (or a group of users) viewing activities over any given period. For example, in a classroom setting, you may want to see if a student who is having trouble in the class has been viewing presentations regularly. In a business setting, you may want to ensure all new employees have completely viewed a required training presentation.
When creating a new report, you will specify report parameters and run the report before you save it. The data included in the User Statistics report will reflect the filters and date range you specify. You can edit report parameters and refresh the report as needed before you save it to ensure you are getting the data you want.
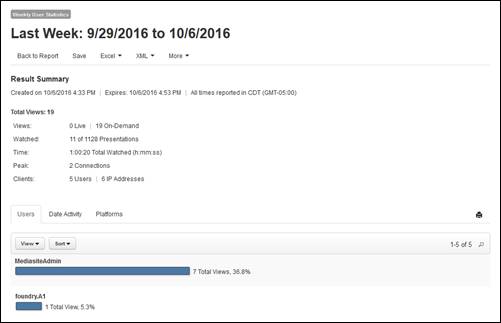
The following views are available at the top-level: users, date activity, and platforms. In the users’ view, click a user’s name to view its summary report. The following report views are available for the selected user: date activity, presentations, and platforms.
To create a new user statistics report:
1. Click Analytics > User Statistics > Add New.
2. Enter a name for the report and specify the filters, date range, time zone, report options. Optionally add recurrence for the report.
3. Click Run to view the report. Click Save to save the results so you can access or share them without running the report again.
User Statistics Report
 Only a report’s owner (the
person who created it) or a user with administrator privileges can delete a
saved report.
Only a report’s owner (the
person who created it) or a user with administrator privileges can delete a
saved report.