Create a Presentation Statistics report to see how many of your presentations are being watched during any given period. When creating a new report, you will specify report parameters and run the report before you save it. The data included in the Presentation Statistics report will reflect the filters and date range you specify. You can edit report parameters and refresh the report as needed before you save it to ensure you are getting the data you want.
The following views are available at the top-level: presentations, date activity, and platforms. In the presentations view, click a presentation’s title to view its Presentation Summary report. The following report views are available for the selected presentation: date activity, users, IP addresses, viewing trends, and platforms.
To create a new presentation statistics report:
1. Click Analytics > Presentation Statistics > Add New.
2. Enter a name for the report and specify the filters, date range, time zone, report options. Optionally add recurrence for the report.
3. Click Run to view the report. Click Save to save the results so you can access or share them without running the report again.
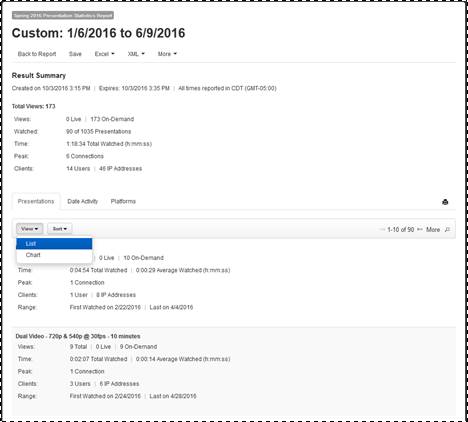
Sample Presentation Statistics Report (Presentations List View)
 Only a report’s owner (the
person who created it) or a user with administrator privileges can delete a
saved report.
Only a report’s owner (the
person who created it) or a user with administrator privileges can delete a
saved report.