View quiz results
For presentations with quizzes added, you can view reports
containing scores for all students who have completed quizzes. You can also
filter report data and download it to XML and Microsoft®
Excel files.
To view report containing quiz results:
1. On the
presentation’s properties page, click View
Analytics.
2. Click
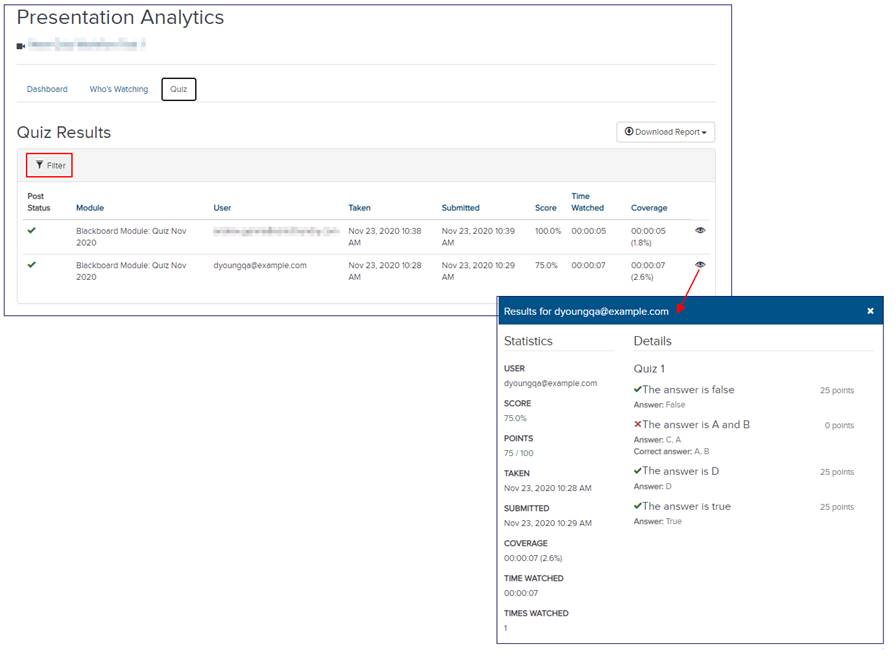
Quiz to see a list of quiz results containing the following
information:
|
Category |
Description |
|
Post Status |
 or or  indicates whether quiz results
were posted to LMS (if applicable) indicates whether quiz results
were posted to LMS (if applicable)
|
|
Module |
Module associated with the presentation |
|
User |
Lists the username of the person who took the
quiz. |
|
Taken |
Date and time of when the quiz was
taken. |
|
Submitted |
Date and time of when the quiz was
submitted. |
|
Score |
Percentage of questions answered correctly (out of
100%) |
|
Time Watched |
Time spent watching the presentation
(hh:mm:ss) |
|
Coverage |
The amount of the presentation watched by a student
based on total duration.
Example: A student opens a
presentation and watches the first 30 minutes of a presentation, pauses
the video, seeks back to the start and watches for 40 minutes. The
coverage for this student is 40 minutes. In other words, the student spent
a total of 70 minutes watching the presentation (total time watched), but
in that time the student only “covered” the first 40 minutes of the
presentation. |
|
Details |
Click the Details button  to review individual question
results for a specific student. Details also includes a breakdown of
results for each quiz. The details page also contains all of the above
information. to review individual question
results for a specific student. Details also includes a breakdown of
results for each quiz. The details page also contains all of the above
information. |

Quiz results report and report
details for user
3. To
filter the report data and capture meaningful information about your students’
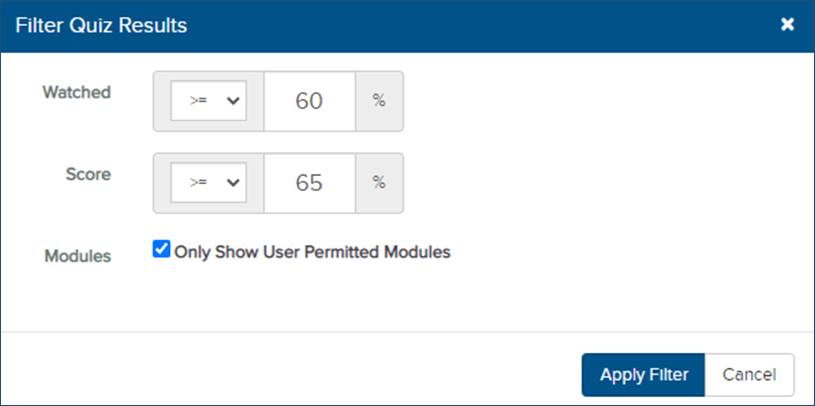
performance, click Filter.
4. Enter
a value (0-100) into the % field for either
Watched or Score. You can use the two filters
together to narrow your search. For example, you would enter 60 in the
Watched field and 100 in the Score field to
see all students who viewed 60% or more of the presentation and scored 100% on
all quizzes. Select one of the following operators from the drop-down
menu(s):
|
Category |
Description |
|
>= |
Return results greater than or equal to the percentage
value entered. |
|
> |
Return results greater than the percentage value
entered. |
|
<= |
Return results less than or equal to the percentage
value entered. |
|
< |
Return results less than the percentage value
entered. |
|
= |
Return results equal to the percentage value
entered. |
|
≠ |
Return results not equal to the percentage
value entered. |
5. Select
the Only Show User Permitted Modules check box to limit the results shown
to your modules. This is useful if you are auditing the results in the grade
book.
6. Click
Apply Filter.

Filter quiz results by percentage
watched and score
7. To
remove the filter, click Filter > Clear Filter.
 or
or  indicates whether quiz results
were posted to LMS (if applicable)
 to review individual question
results for a specific student. Details also includes a breakdown of
results for each quiz. The details page also contains all of the above
information.
