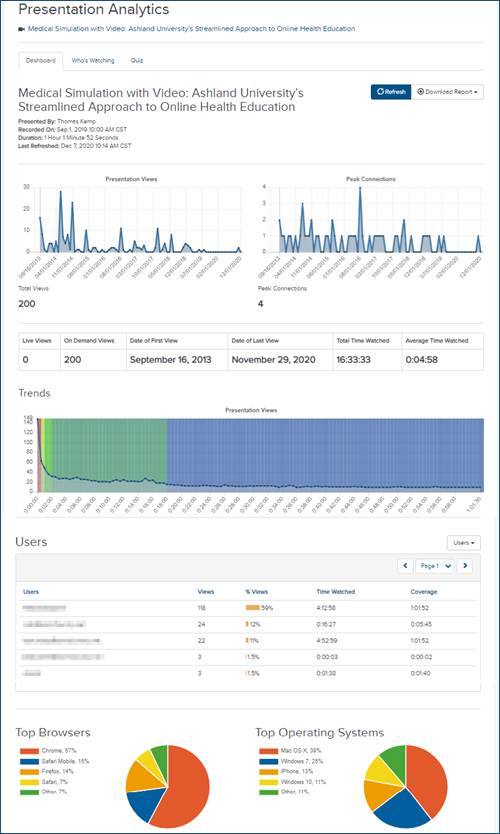
For each presentation, you can view detailed analytics that will display viewing statistics—performance data, viewing trends, top users, etc.
To view a presentation's analytics:
1. On the presentation’s properties page, click View Analytics.
2. Select the Dashboard tab.
3. Click Refresh to update the data shown.
4. Click the Users drop-down menu to toggle your view between users and IP addresses.
Presentation analytics report (Dashboard)